Real World Results
Curious about what type of results you can expect using the Fast Bat in
conjunction with our Overload-Underload Power Development system?
Well, we tested it out firsthand over the course of 6 weeks, originally in 2007. Our results were nothing short of astounding. We were able to add 34 mph to one player's swing and we were able to get two 17-year-olds up to 90 mph! That tells you how powerful our product is. Check out the results below and feel free to contact us regarding anything you see. We have continued to use the product with players from Little League all the way up to the Major Leagues and have sold hundreds more since this initial test. The results have withstood the test of time!
TESTING PROTOCOL
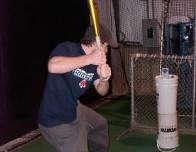
1) All bat speed readings were obtained using the Swing Speed Radar. Hitters would
stand in front of the bat speed monitor and take dry swings. Pre- and Post-testing
conditions remained identical.
2) The weight of the Overload-Underload bats used during the 6 week period was
determined by the players game bat weight. All high school players tested out using
regulation -3 bats.
3) It should be noted that the following program took place over the course of 6 weeks (18
total sessions). However, a number of players missed a significant amount of time for
various reasons. On a whole the players who were the most consistent in coming to the
sessions made the biggest jumps in bat speed. If a player missed more then 3 weeks of
classes (9 total sessions), we made note of it.
4) As a reference, it has been proven that for every 1 mph in bat speed a player gains, it
will increase the distance the ball travels by 6 feet (see reference)!
Nathan, Alan. Nuclear Physics Professor. University of Illinois at Urbana-Champaign.
Average Bat Speed Improvement
14.1 mph!
Average Peak Bat Speed Improvement
15.9 mph!
Increased Ball Travel Distance:
96 FEET!!
12 players
6 week program – 3 times per week
MATT
Week 1 Week 6 Improvement
Average Bat Speed: 59.2 mph 70 mph +9 mph
Top Bat Speed: 61 mph 75 mph +14 mph
Estimated increase in ball travel distance: 54 feet
ANTHONY
Week 1 Week 6 Improvement Average Bat Speed: 52.8 mph 67.9 mph +15 mph
Top Bat Speed 55 mph 74 mph +19 mph
Estimated Increase in ball travel distance: 90 feet
TOM Y.
Week 1 Week 6 Improvement Average Bat Speed: 76.6 mph 86.2 mph +9.6 mph
Top Bat Speed: 80 mph 90 mph +10 mph
Estimated increase in ball travel distance: 60 feet
TIM
Week 1 Week 6 Improvement
Average Bat Speed: 46 mph 70.1 mph +23.2 mph
Top Bat Speed: 54 mph 71 mph +17 mph
Estimated increase in ball travel distance: 138 feet !
JAY
Week 1 Week 6 Improvement Average Bat Speed: 63 mph 74.5 mph +16.5 mph
Top Bat Speed: 58 mph 81 mph +18 mph
Estimated increase in ball travel distance: 99 feet
TOM M.
Week 1 Week 6 Improvement Average Bat Speed: 50.2 mph 60.1 mph +9.9 mph
Top Bat Speed: 56 mph 63 mph +7 mph
Estimated increase in ball travel distance: 60 feet
DAVE
Week 1 Week 6 Improvement
Average Bat Speed: 60 mph 72.7 mph +12.1 mph
Top Bat Speed: 65 mph 77 mph +12 mph
Estimated increase in ball travel distance: 72 feet
ZAK
Week 1 Week 6 Improvement
Average Bat Speed: 48.4 mph 55 mph +6.5 mph
Top Bat Speed: 53 mph 59 mph +6 mph
Estimated increase in ball travel distance: 36 feet
**MISSED 9 classes (1/2 of total program)**
VIN
Week 1 Week 6 Improvement Average Bat Speed: 73 mph 84.5 mph +12.2 mph
Top Bat Speed: 76 mph 90 mph +14 mph
Estimated increase in ball travel distance: 72 feet
JOE
Week 1 Week 6 Improvement Average Bat Speed: 51 mph 62.4 mph +11.4 mph
Top Bat Speed: 53 mph 66 mph +13 mph
Estimated increase in ball travel distance: ~70 feet
JEFF
Week 1 Week 6 Improvement
Average Bat Speed: 66.6 mph 77 mph +10.4 mph
Top Bat Speed: 69 mph 79 mph +10 mph
Estimated increase in ball travel distance: 60 feet
**Missed 9 sessions (1/2 total program)**
DAN
Week 1 Week 6 Improvement
Average Bat Speed: 44.6 mph 72 mpph +27.4 mph
Top Bat Speed: 46 mph 80 mph +34 mph
Estimated increase in ball travel distance: 168 feet!